Radius
This web-based B2B application provides tools to Environmental Consultants, Building Engineers and Commercial Appraisers to help them streamline processes, easily access data, and manage risk.
The Project

Antiquated user interface.

City directory catalogs.

Old Sanborn maps.
Timeframe: 8 months
Roles: Branding | UX + UI Design | User Research | Production
Platforms: Web App
For over 29 years, Radius has been building a wealth of environmental and property data, currently with a repository of over 4.1 billion records, from both digital and analog sources. The Radius digital platform brings together multiple types of data such as radius maps, area and corridor studies, vapor and gas encroachment data, environmental reports, topographic maps, market due diligence scores, Sanborn maps, historical aerial photos, chain of titles, property tax maps and more. Research consultants use the application's map interface to map out the area to be researched and then the platform's tools generate high quality reports which are delivered to corporations, government agencies, insurance companies and legal professionals.
—
The Challenge
There were three main challenges in working on this product. First and most evident was the antiquated user interface which was using patterns from over 15 years ago and needed a complete refresh. The second challenge was working with a myriad of data types, especially analog data. The final challenge was the sheer nature of a research consultant's job, which was typically in the field and on the go. This made it difficult at times to access all of the application's tools, as it was optimized for desktop browser use and a field app had not yet been developed.
—
The Process
The project started with a knowledge transfer, where our design and product teams worked very closely with subject matter experts on the Radius team to fully understand the historical context, all of the current pains of the product, as well as all the intricate details of each types of property data.
A user interface audit was performed and research conducted into existing web ui libraries that we could use as a starting point. Since the brand already existed we simply needed to adjust the attributes of the ui library to express the brand. We also researched the latest in GIS mapping technology to improve the mapping features.
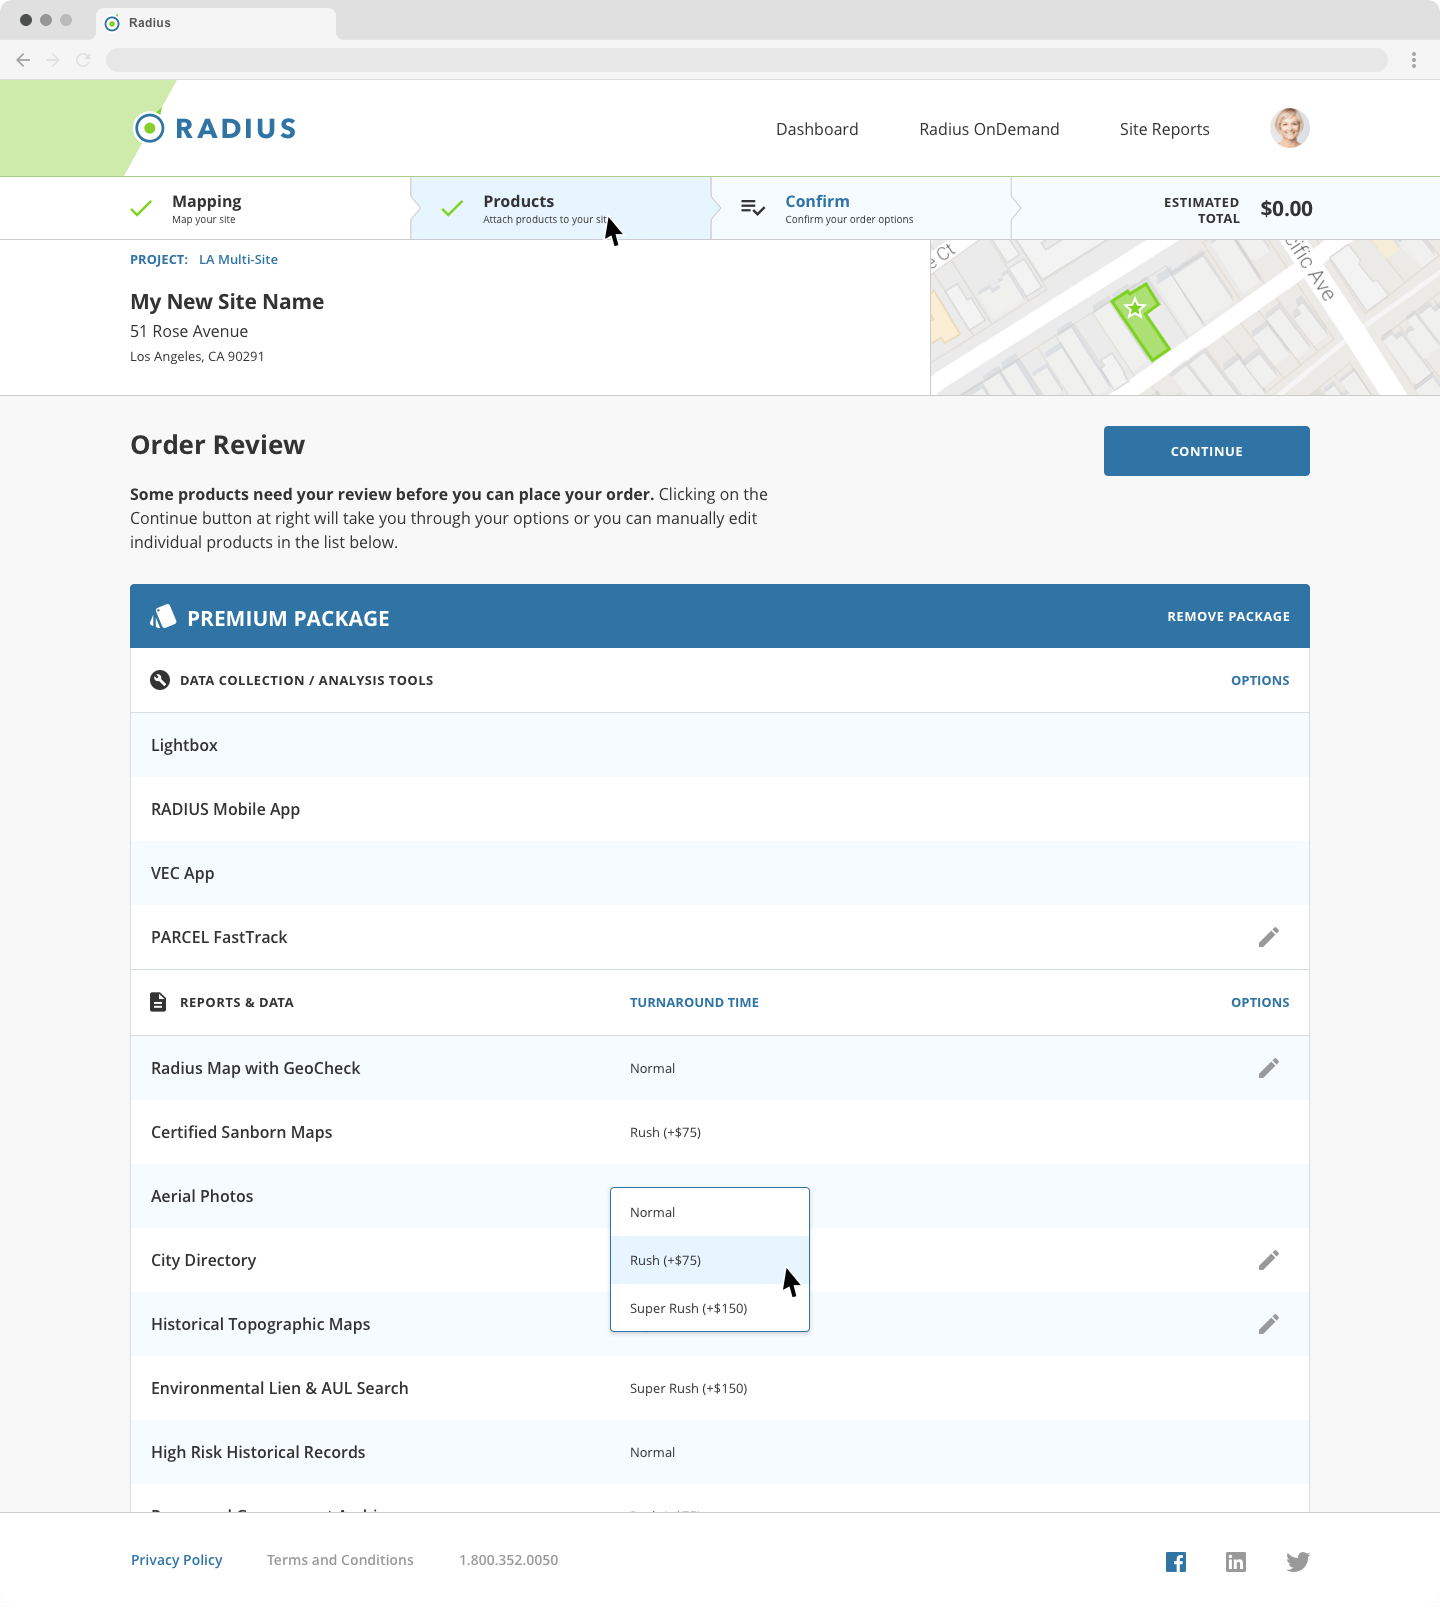
Once we settled on the direction, design started first with low fidelity wireframes to gather requirements and then on high fidelity comps for each of the dashboard views, product details and checkout screens. I worked very closely with two engineers to prototype high fidelity motion concepts, map drawing overlays, error and empty states, and other micro-interactions.
Throughout the process we performed usability interviews with actual research consultants from various parts of the country using the beta app in the field. These interviews helped us assess the performance and usability of our beta build.
—
My Role
UX and UI audits
UX research and testing
User interface design
Prototyping
Design system and pattern library
Developer support and collaboration

Results
+29 years
Time spent aggregating a wealth of property data.
4.1 billion
Number of property records in the repository.
+$2 trillion
Number of real estate transactions reported annually.